Case Study
Art Analytics.
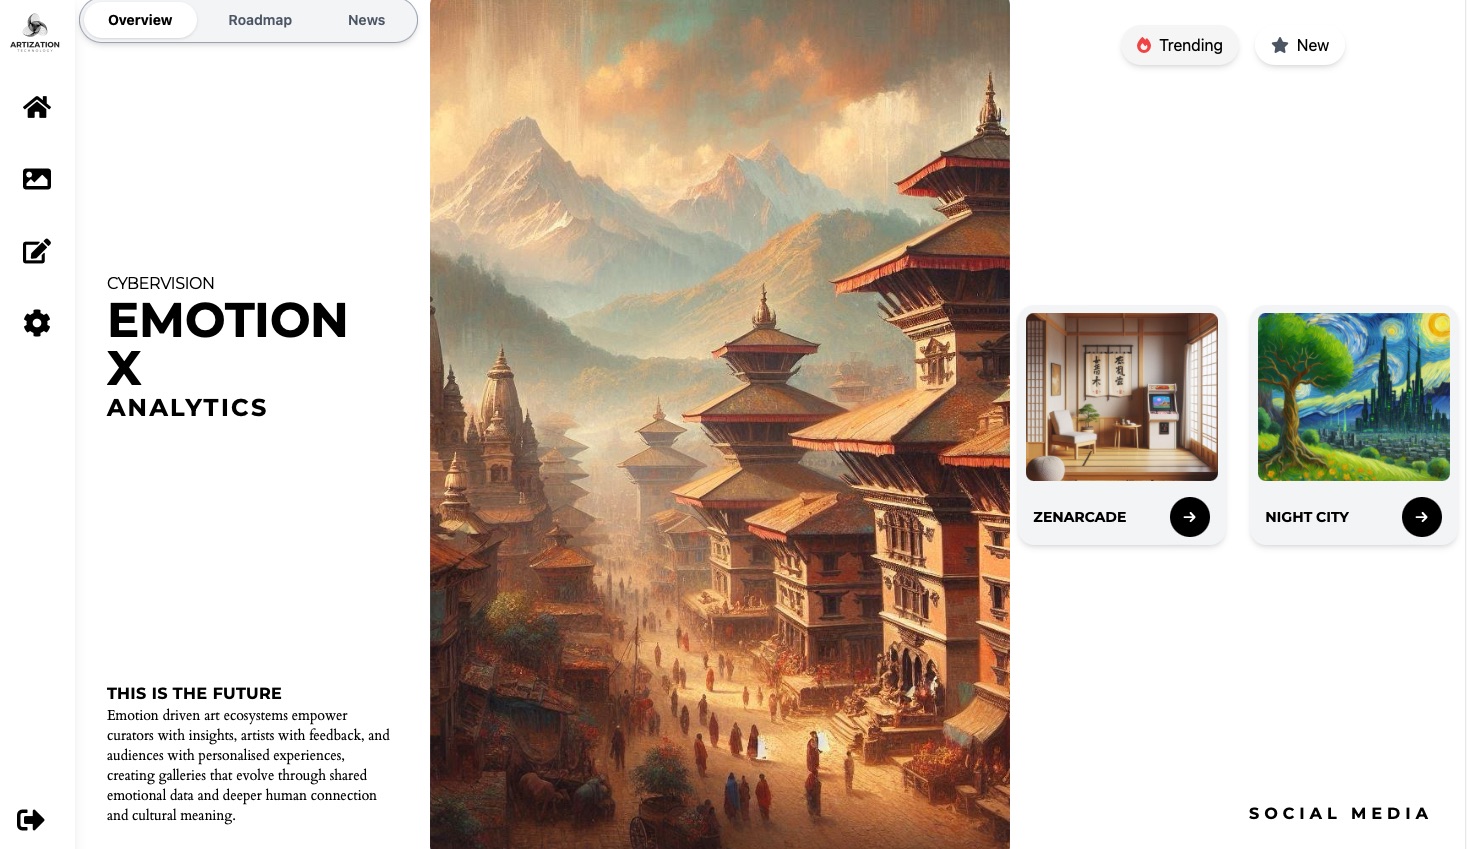
A computer-vision SaaS that understands how people emotionally respond to artwork. I led this project from prototype UI to fullstack development and now project management by translating the R&D insights into a calm, tactile interface that mirrors the soft gradients of curated galleries.
Client
Artization
Date
July 2024
Service
Product · Web
Challenge
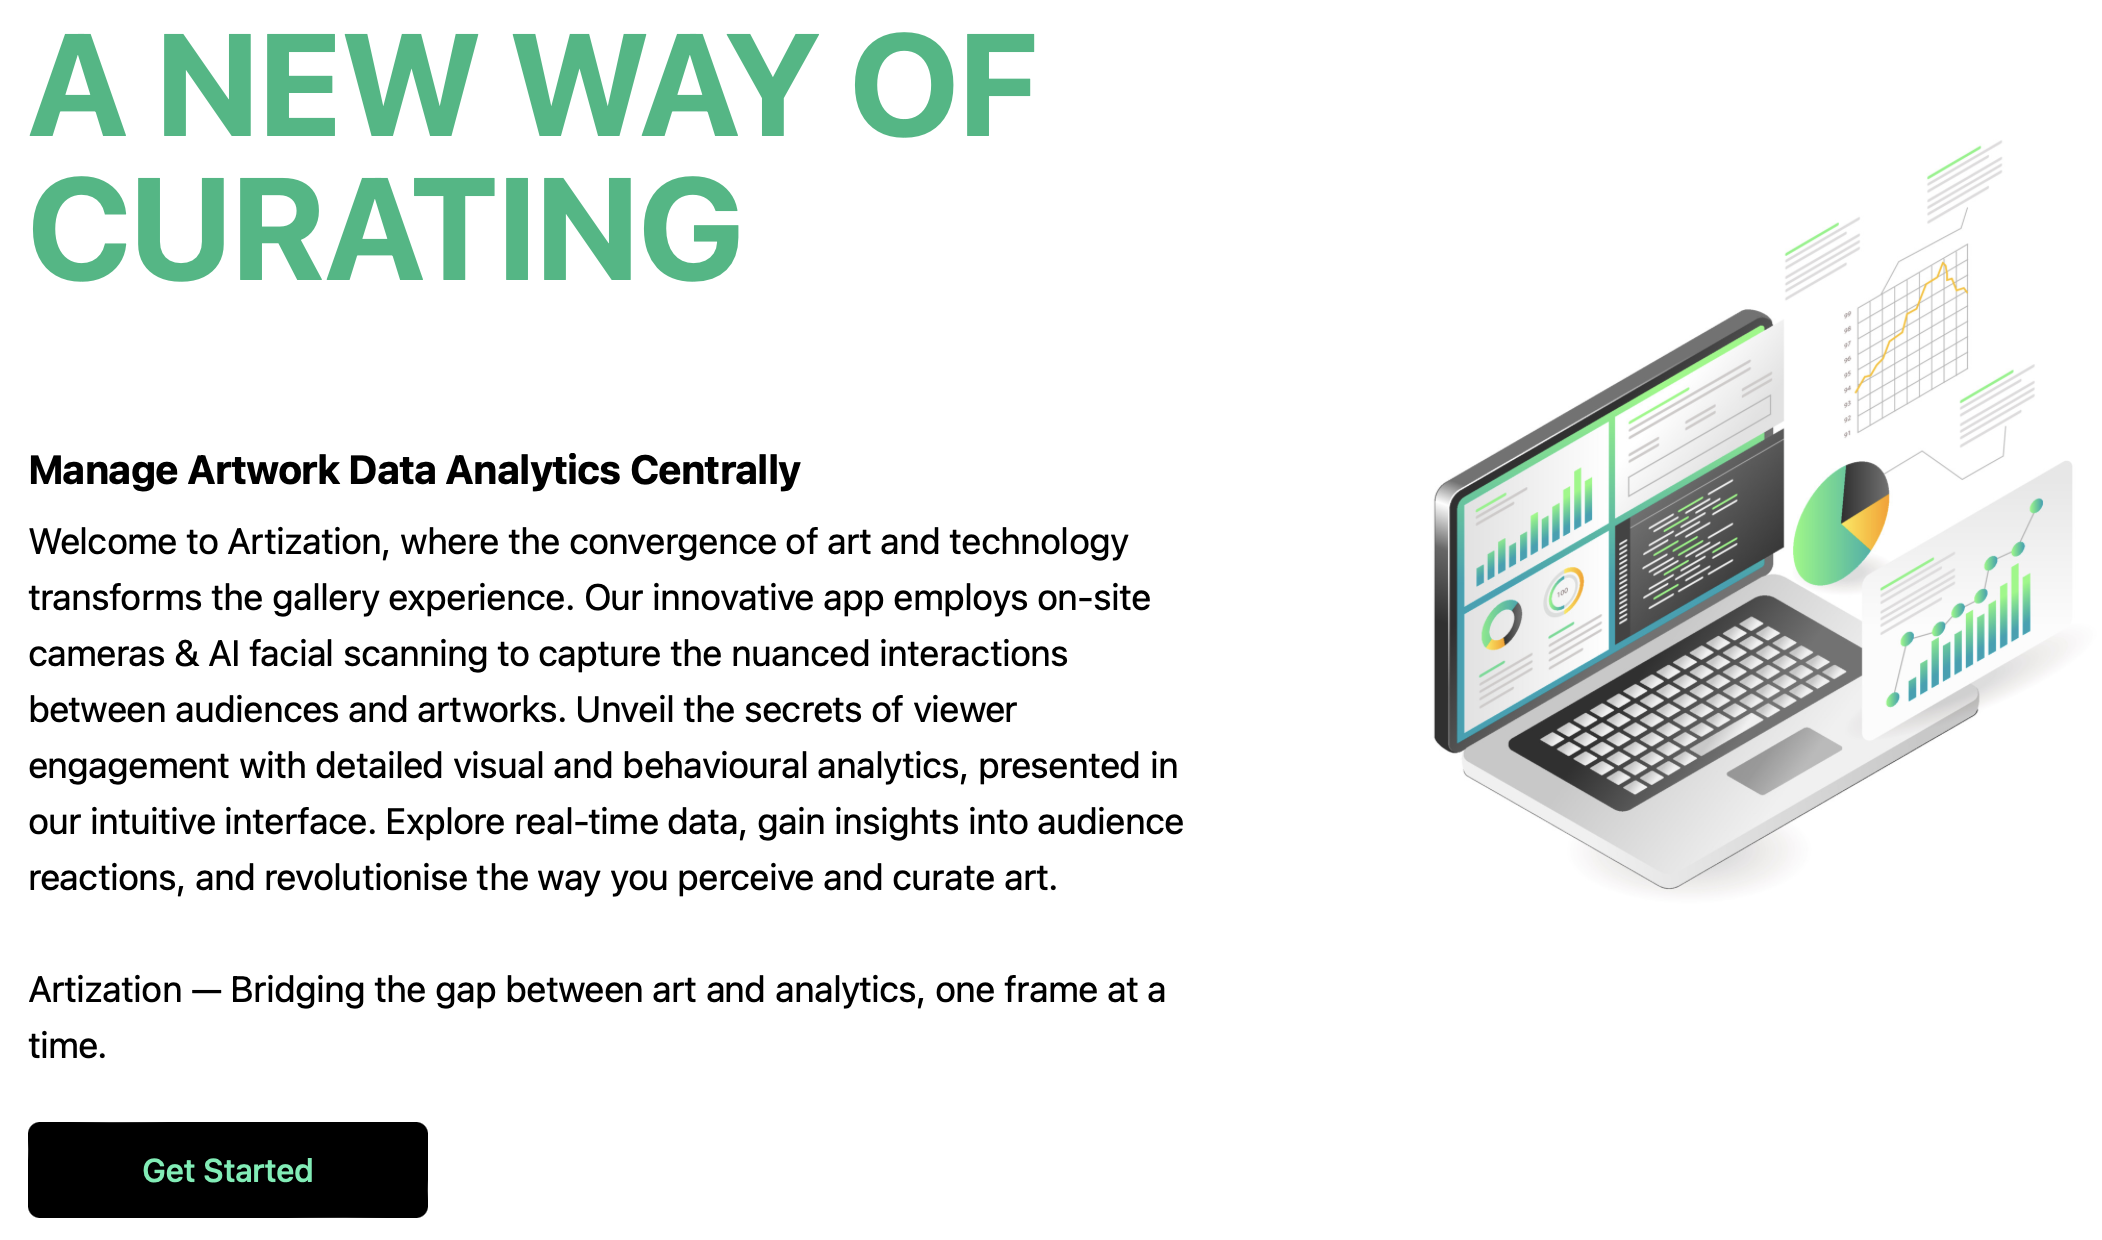
Galleries trusted gut feeling more than dashboards. Artization needed to visualise emotion tracking without looking sterile. My goal was to blend analytical clarity with a soft, gallery grade presentation so curators still felt in control of the story.
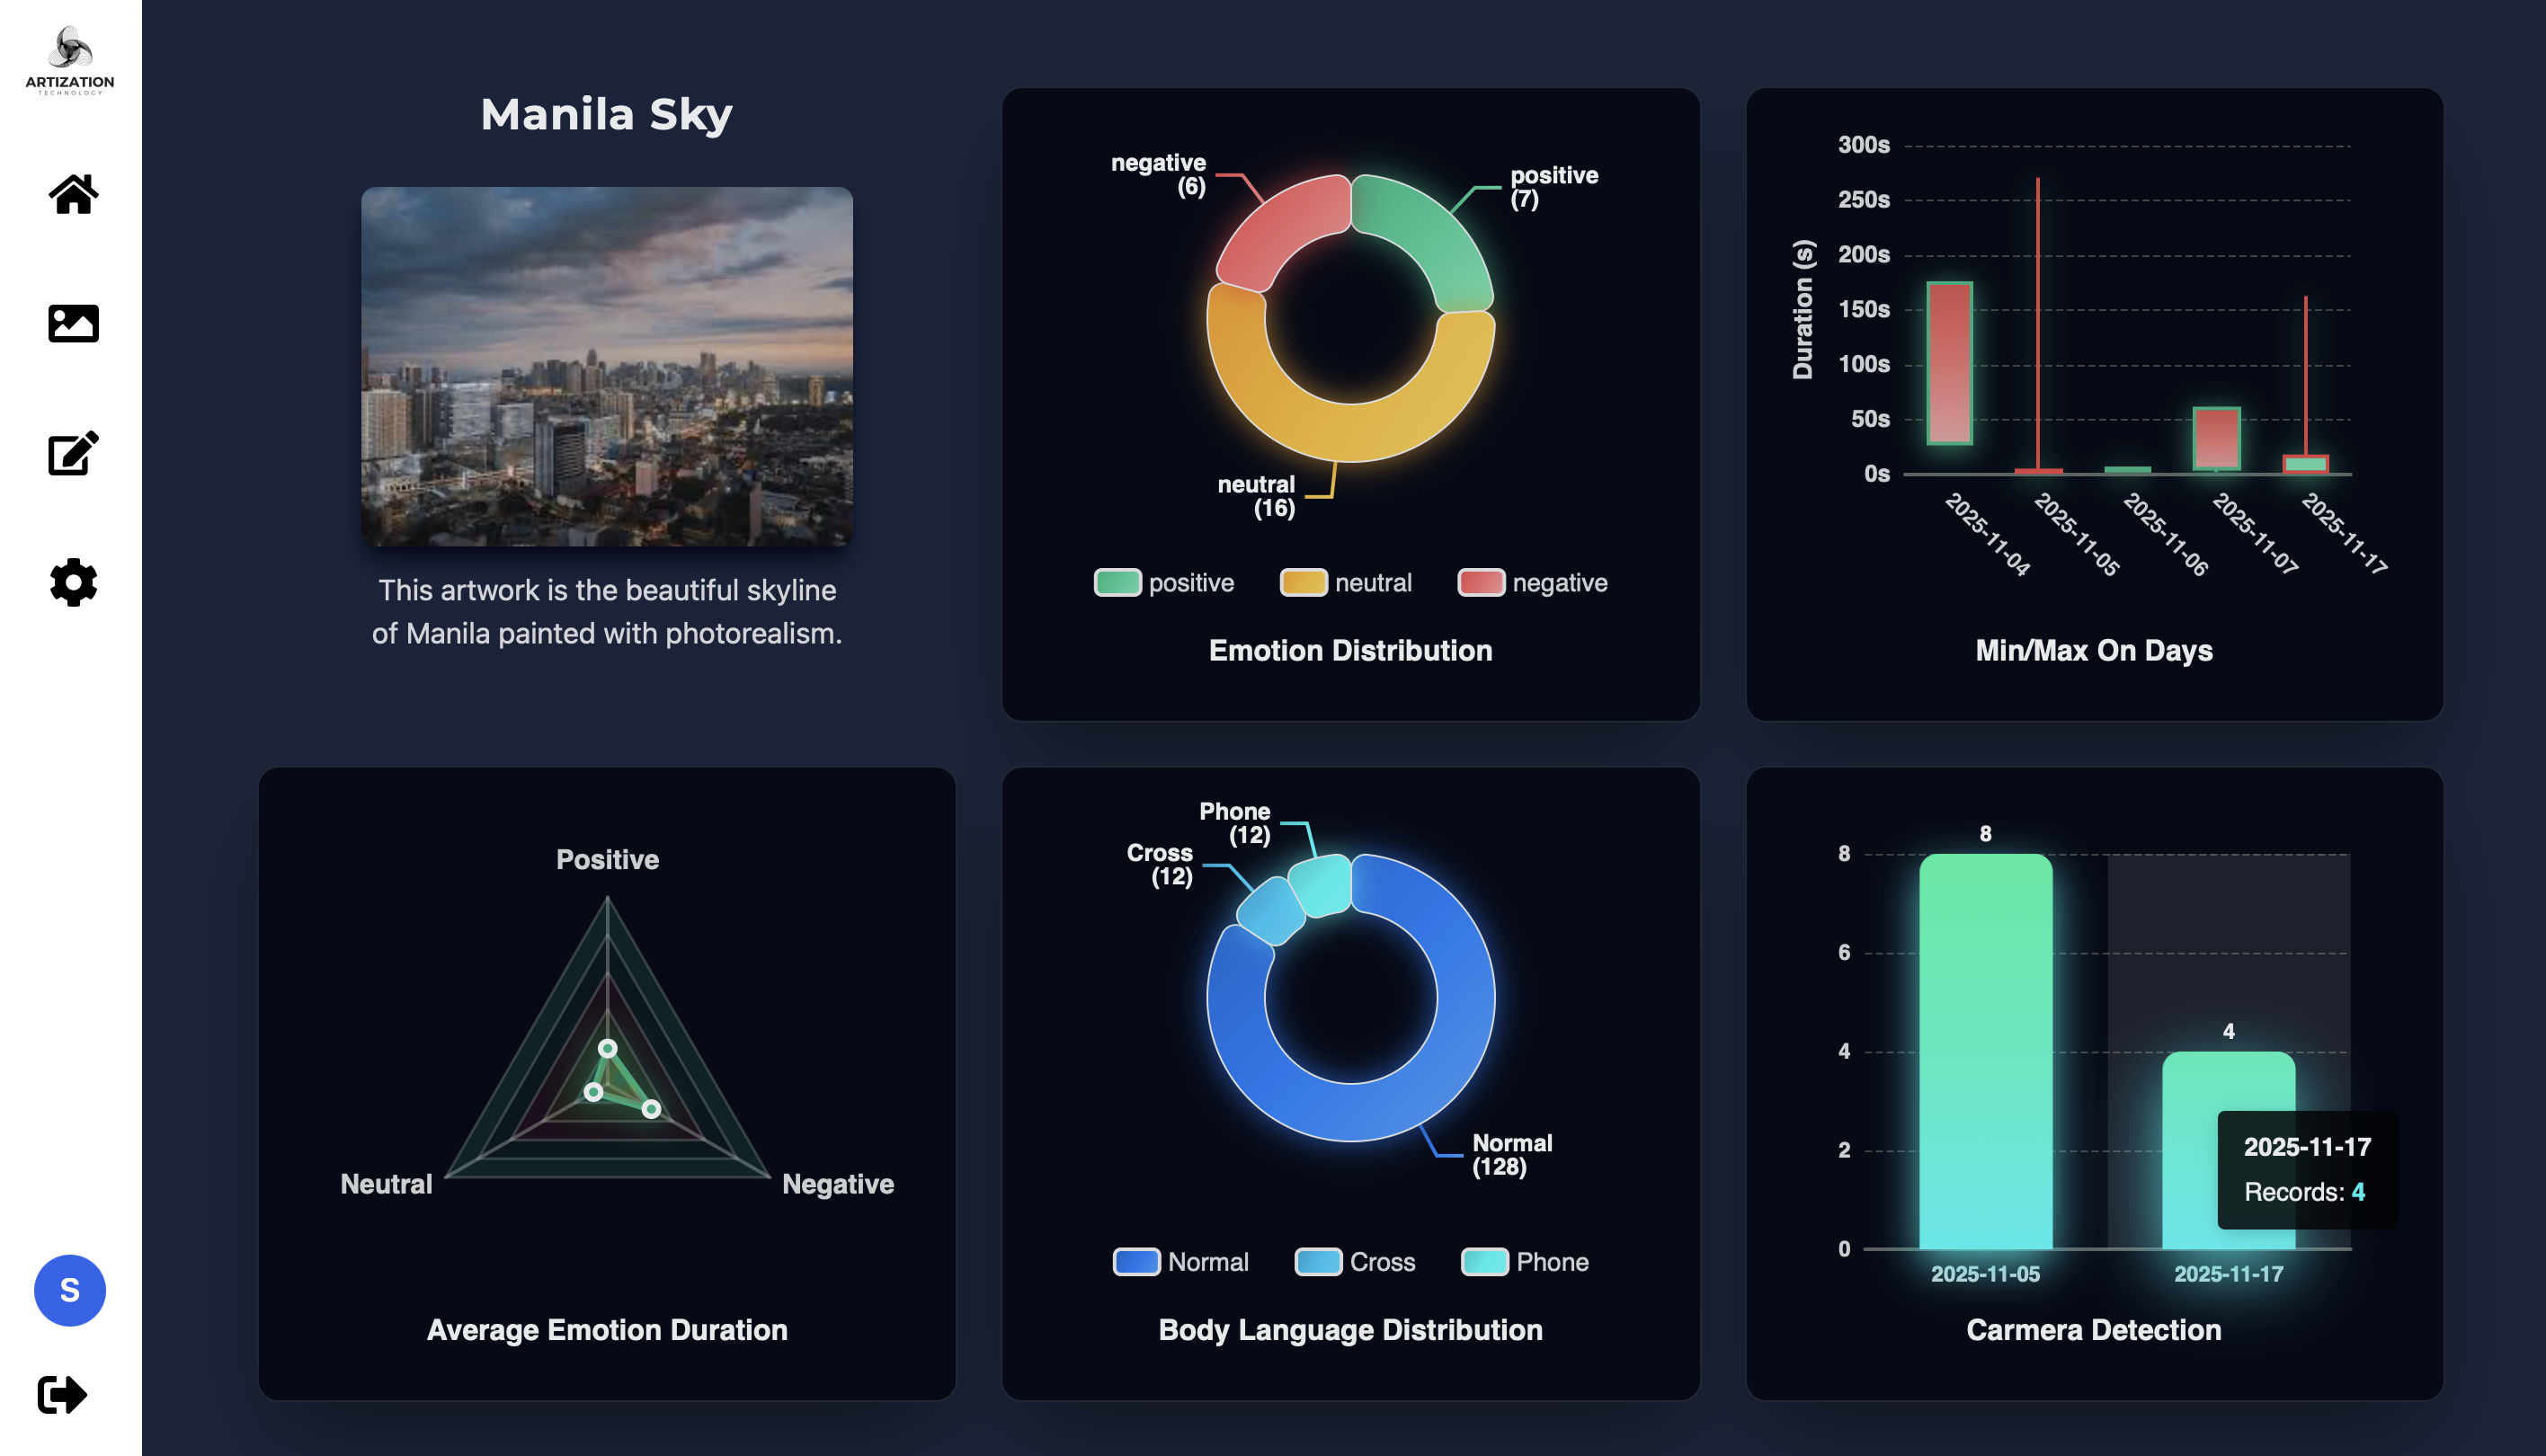
We mapped every machine learning insight into an analytical graph and supported it with tactile UI modules inspired by museum placards and lightboxes.
- • Stacking data cards with subtle glows to coordinate data outcomes easily to the eyes.
- • Contextual glossary captions so non technical stakeholders never feel lost.
- • Tailwindcss-powered system that mirrors the clean and spacial feeling of galleries and museums.
Project Results
Launching with this calm visual system meant every view count, reaction and AI summary felt as considered as the artwork itself. The experience is still under production but will soon launch to market with walk-through demos.
- Insight analytics render automatically in print ready layouts.
- Gallery partners understand how models evaluate emotion at a glance.
- Curators can instantly see detailed traffic and reactions through their gallery.
Testimonial
“This is the first time our machine learning work feels as elegant as the exhibitions we curate. Investors understand the value within five minutes.”
Tony Mercier — CEO, Artization